Analytics is the important step in business structure nowadays. First of all, in order to build a successful project of yours, you need to pay a huge attention to analytic section. Business analytics allows you to plan business model, so it means to explore and investigate the past businesses, all the possible risks, the marketplace segments for your business. As you can see, it’s unacceptable to skip this part in preparation you business.
How exactly the analytics is going on? More tools help Business Manager to do the analytic things. Please, welcome some key analytic tools:
- business experiments;
- visual analytics;
- correlation analysis;
- regression analysis;
- scenario analysis;
- forecasting/time series analysis;
Telling briefly and clearly, we analyze all these tools (isn’t funny to analyze the analytic tools?) and find out that the most useful and favourite among the Business Managers all over the world is the second tool — visual analytics.
We googled for the top analytic tools and wonder that Android tools are much more represented than iOS tools. VRG Soft team has decided to fix the situation and create an incredible Analytic tools application for iOS. So, let me introduce the new Analytic tool for iOS SMDiagramView.
The main advantage is colorful customizable interface. When you start to use it for the first time, be sure you can’t stop looking at the brightly segments, movable angles and the other features you are welcome to use. Move, colorize, bright are like by yourself from the first moment. Let’s have a closer look at this application.
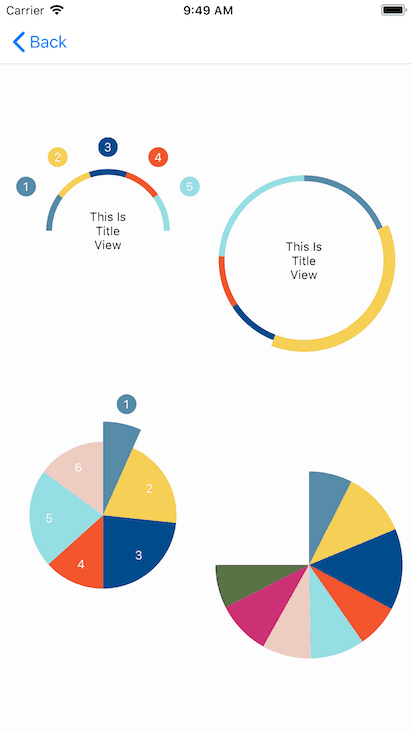
First of all, you need to decide how do you want your data to look like. Our developers propose you Arc/Segment mode.
Arc mode shows your data diagram in a line with definite angles. It looks modern and simply at the same time.
Segment mode shows your data diagram, it looks like a circle with the segments you need.
You can also see the settings for yourself like as Radius for segments, Radius for views, Start angle, End Angle, Arc width.
You can change and control the radius for segment, that provides you as much size of your data field as you want.
You can change and control the radius for views, that helps your eyes to concentrate on the details.
You can rotate your diagram with the point for Start and End Angles, that provides you to contain as much more data into your diagram.
And now some technical details.
Requirements
- Xcode 9
- iOS 9.x+
- Swift 4
Compatibility
- IOS 9-11
You can enjoy our new library here.